NOTICE
We use cookies to improve the user experience and analyze its performance.
Choosing the best onset data logger is rarely a simple matter of selecting the newest model. The right choice depends on measurement range, sensor accuracy, deployment length, data access, and site conditions. A logger monitoring a museum display case faces different demands from one installed inside a greenhouse or refrigerated truck.
The International Energy Agency’s Energy Efficiency 2023 report states that buildings represent about 30% of global final energy consumption. Reliable temperature and humidity records can reveal unstable HVAC performance, moisture risks, and unnecessary energy use. The World Meteorological Organization’s State of the Global Climate 2023 also confirmed exceptional global heat, making continuous environmental monitoring increasingly practical rather than optional. Small errors matter.
In real projects, an experienced technician checks more than the product page. They verify calibration status, probe placement, battery behavior, memory capacity, and software compatibility. Bluetooth access may save a ladder climb, while a remote cellular model may protect data from a distant warehouse. Yet convenience can hide limitations. Wireless range changes around concrete walls. Batteries weaken in cold rooms. Sensors can drift when exposed to condensation.
This guide compares leading Onset models by application, not popularity alone. It considers temperature, relative humidity, light, carbon dioxide, water level, and external-probe requirements. Manufacturer specifications provide a starting point, while field reports and recognized measurement practices provide essential context. No single logger wins every test. The most defensible choice is the model that produces trustworthy data under your actual conditions, including the imperfect ones.
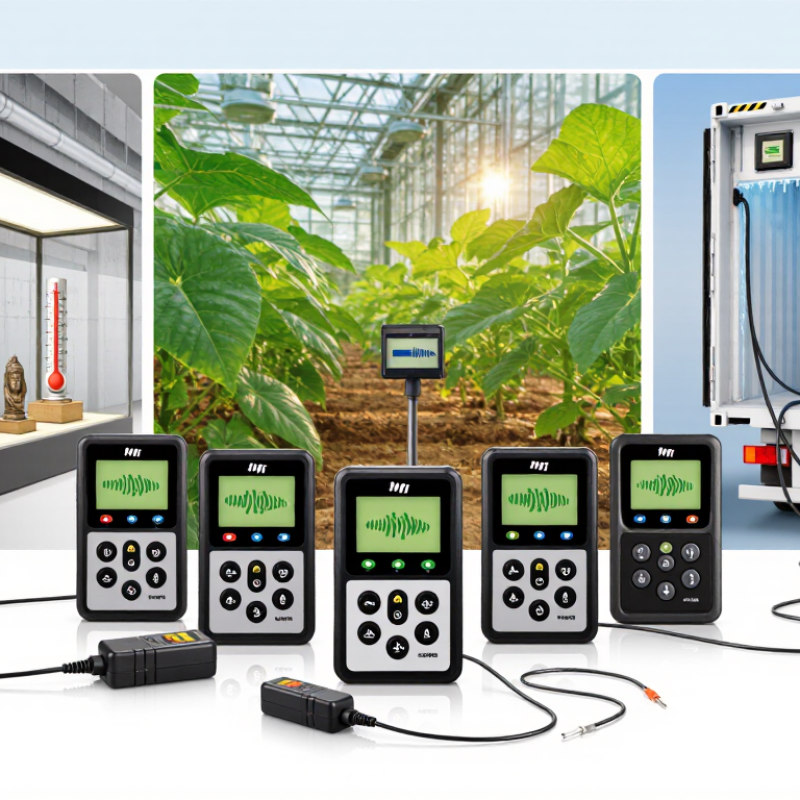
A data logger is a compact electronic instrument that automatically measures and stores conditions over time. It combines sensors with a clock, memory, and a power source. Depending on its configuration, it can record temperature, relative humidity, light, pressure, voltage, or water level. Unlike a spot check, it creates a time-stamped record. Useful on site.
That record can reveal short peaks or gradual changes that occasional manual readings miss. The U.S. Environmental Protection Agency’s report The Inside Story: A Guide to Indoor Air Quality estimates that people spend
about 90 percent of their time indoors.
That figure does not mean every room needs monitoring, but it shows why indoor conditions deserve attention. One reading can be misleading.
Choosing a model starts with the variable, measurement range, required accuracy, and recording interval. For example, a logger set to record every five minutes stores 8,640 readings in 30 days on one channel. Check battery life, memory, sensor placement, and calibration needs before deployment. A logger records what happened; it does not explain why. That distinction is easy to overlook.
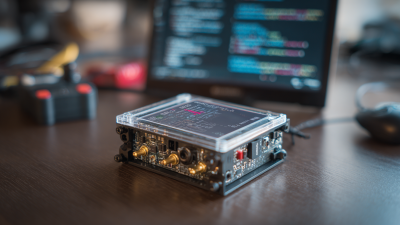
Choosing the best data logger model depends on the measurement task, not the product label. Compare channel count, sensor compatibility, accuracy, memory, sampling interval, and battery life. A logger tracking a refrigerated cabinet may need two-minute readings, while a warehouse study may need fifteen-minute intervals.
Check the numbers closely. A 2023 UNEP Global Status Report states that buildings consume about 34% of global energy and produce roughly 37% of energy-related emissions. That makes reliable temperature, humidity, and energy data valuable for facility decisions.
For indoor monitoring, select a model with stable long-term drift performance and clear alarm thresholds. For outdoor deployment, inspect the enclosure rating, condensation resistance, and operating temperature range. Small details matter.
Connectivity also changes the workflow. Bluetooth can simplify spot checks, while cellular transfer supports remote sites but increases power use and subscription costs. Memory capacity should match the logging interval and inspection schedule. A monthly field visit can expose weak storage planning.
Calibration evidence matters too. ISO/IEC 17025-based calibration and traceable reference equipment improve confidence when readings affect compliance or maintenance. Still, specifications are not field performance. I have seen sensors pass a bench test, then struggle near a cold metal surface.
Mounting position, airflow, and human handling can distort useful data. Test the setup before scaling it.
Choosing the best data logger begins with the measurement, not the feature list. For a vaccine refrigerator, confirm the sensor’s temperature range and accuracy, then choose an interval that can capture brief door openings. A greenhouse may need several channels for air temperature, humidity, and soil conditions. Check memory capacity against the planned download schedule. Small details matter.
The International Energy Agency’s 2023 Buildings report estimates that building operations account for about 30% of global final energy use and 26% of energy-related emissions.
That scale makes dependable monitoring useful, but the right logger depends on the site. For remote equipment, compare battery life, wireless range, and alert options. In a wet or dusty room, inspect the enclosure rating and sensor placement requirements. Ask whether calibration records are available, and confirm that the stated accuracy covers your actual operating range. More channels can help, but they may add setup complexity. That trade-off is real. A short pilot can reveal missed readings, awkward mounting, or intervals that are too slow—problems a specification sheet may not show.
Choosing a data logger starts with the variable being measured. Temperature-and-humidity models suit building checks, archives, and storage rooms. The U.S. Energy Information Administration’s 2018 Commercial Buildings Energy Consumption Survey recorded 6,826 trillion Btu of site energy use. That scale makes HVAC monitoring useful, though a logger alone cannot explain high consumption.
For outdoor monitoring, weather models can track temperature, humidity, rainfall, and light. The World Meteorological Organization’s Guide to Instruments and Methods of Observation emphasizes consistent instrument exposure and measurement practices. Placement matters. A sensor beside a sunny wall may record the wall, not local air.
For cold rooms, choose a temperature logger with a suitable probe, clear alarm limits, and records that are easy to retrieve. Place the probe where stored goods experience typical conditions, not directly beside a cooling outlet.
Process monitoring may call for voltage, current, or pressure inputs, while fieldwork often benefits from long battery life and weather-resistant housing. Match the sampling interval to the event: a slow interval can miss brief temperature swings. Easy to overlook.
More channels are not automatically better, either; they can add setup work without improving the decision. Check measurement range, stated accuracy, calibration options, and software access before selecting a model.
A perfect logger does not exist.
Choosing a data logger starts with the installation site, not the feature list. Check the expected temperature range, moisture exposure, mounting space, and sensor cable length. A logger placed inside a shaded enclosure may behave differently from one fixed to a sun-warmed wall. Secure the unit, keep connectors accessible, and avoid routing cables beside power lines when possible. Small details matter.
During setup, confirm the clock, measurement interval, sensor type, and units before leaving the site. Take a reference reading with a trusted instrument, then record the logger’s location and installation time. A short test run can reveal loose connections or unexpected gaps. It takes minutes.
Still, field conditions are rarely as tidy as a workbench, and a carefully planned setup can miss an awkward cable bend.
For collection, choose an interval that captures meaningful changes without filling storage too quickly. Fast-changing conditions may need frequent readings; stable environments may not. After downloading, inspect timestamps, missing values, and sudden jumps before calculating averages.
Keep an untouched copy of the raw file, and note any sensor replacement or site disturbance.
Graphs help, but they can hide brief events when time scales are too broad. I would also revisit the chosen interval after reviewing the first dataset; the original setting is often only an informed guess.