NOTICE
We use cookies to improve the user experience and analyze its performance.
Why Choose a Water Monitoring System?
Water quality can change before anyone notices a smell, color, or visible sediment. A water monitoring system helps turn hidden changes into measurable evidence. It can track pH, temperature, turbidity, conductivity, dissolved oxygen, and other key indicators. In a treatment plant, sensors may detect unusual readings within minutes. In a river, they can reveal pollution patterns after rainfall. That speed matters when decisions affect public health, equipment, and environmental protection.
Peter H. Gleick, a respected water expert and president emeritus of the Pacific Institute, has said, “Water is the most precious resource on earth.” His statement explains why measurement should not depend on occasional sampling alone. Continuous data can support faster maintenance, clearer reporting, and better resource planning. It can also expose problems that routine inspections miss. Small warning signs matter.
Still, no system is perfect. Sensors need calibration, cleaning, and careful placement. A neglected probe can create confident but inaccurate results. Data also requires trained people who understand local conditions, seasonal changes, and possible sources of error. This is where experience becomes important. The best water monitoring system is not simply the one with the most features. It is the one that produces reliable information, supports sound decisions, and fits the site’s real operating needs. That choice may require patience, testing, and a willingness to question convenient results.
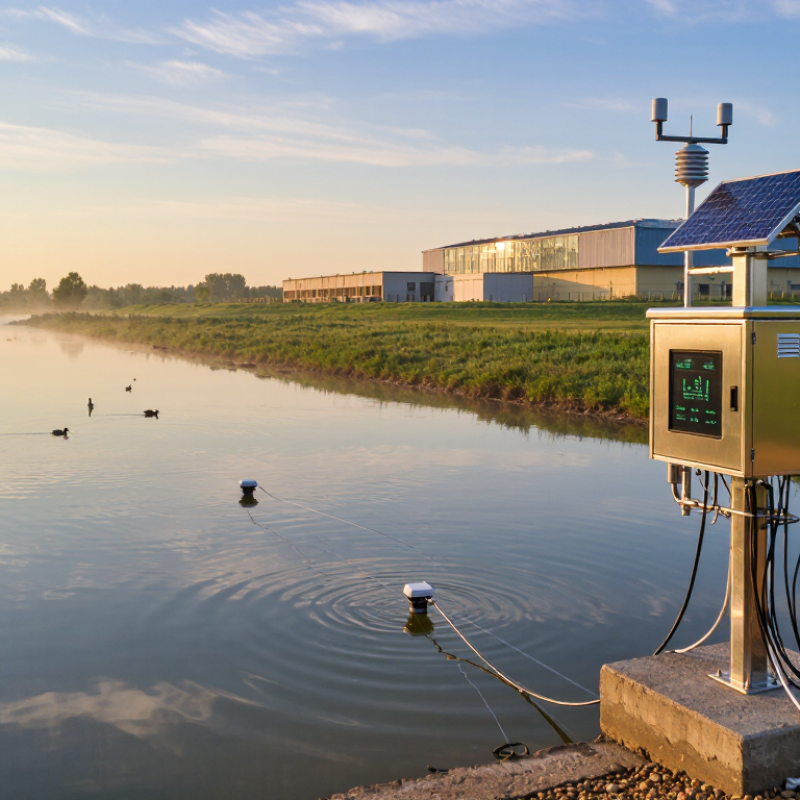
A water monitoring system is a coordinated method for measuring water conditions over time. It combines field sensors, sampling equipment, laboratory tests, data transmission, and alert software. Common measurements include pH, temperature, turbidity, conductivity, dissolved oxygen, and disinfectant levels. Some systems also track nutrients, metals, or microbial risks through scheduled laboratory analysis.
The need is measurable.
The WHO and UNICEF Joint Monitoring Programme reported that 2.2 billion people lacked safely managed drinking water in 2022. Reliable monitoring helps operators identify contamination before it reaches homes, factories, or irrigation channels. A sudden turbidity increase may appear as cloudy water in a storage tank. A conductivity change can indicate salt intrusion or industrial discharge. These details support faster, evidence-based decisions.
Monitoring is not simply installing a sensor. The UNESCO World Water Development Report 2024 states that agriculture accounts for about 70% of global freshwater withdrawals. Therefore, systems should match local risks, flow conditions, and reporting requirements. No sensor is perfect. Calibration can drift, batteries can fail, and poor sampling can distort results. A dashboard may still create false confidence. Regular maintenance, trained staff, documented procedures, and independent laboratory checks make the data more trustworthy. Good systems show the reading, its time, its location, and its uncertainty.
A water monitoring system measures more than a single number. It builds a practical picture of changing water conditions. The most common parameters include temperature, pH, turbidity, conductivity, dissolved oxygen, and total dissolved solids. These readings reveal different risks. Turbidity can signal suspended particles. Conductivity may indicate dissolved salts or industrial influence. Low dissolved oxygen can stress aquatic life.
Many systems also track oxidation-reduction potential, residual disinfectant, and nutrient compounds such as nitrate and phosphate. Advanced programs may test lead, arsenic, pesticides, and microbial indicators in laboratories. Sensors provide speed, but laboratory testing provides deeper confirmation. Both matter. The World Health Organization’s Guidelines for Drinking-water Quality identifies microbial contamination as a major public health concern. The WHO and UNICEF Joint Monitoring Programme reported that 2.2 billion people lacked safely managed drinking water in 2022. Reliable measurement remains essential.
Small changes deserve attention. A sudden pH shift after heavy rain may expose runoff problems. Rising conductivity near a discharge point needs investigation. Sensors can drift, though. Biofouling, air bubbles, and poor calibration create misleading results. That part is easy to underestimate. The U.S. Environmental Protection Agency’s National Primary Drinking Water Regulations connect monitoring with limits for microbial, chemical, and radiological contaminants. Operators should compare sensor trends with routine sampling, maintenance records, and local conditions. A dashboard is useful, but it is not evidence by itself. Some readings will remain uncertain. That uncertainty should be recorded, not hidden.
Why Choose a Water Monitoring System?
How Does a Water Monitoring System Operate?
A water monitoring system uses sensors to measure changing conditions in real time. Common sensors track temperature, pH, turbidity, conductivity, and dissolved oxygen. Each sensor contacts the water directly or samples it through a small flow chamber. The readings travel to a controller, which records values at set intervals. Some systems measure every few seconds. Others use longer intervals to save power.
The controller compares readings with safety ranges selected by trained operators. When a value changes sharply, the system can send an alert through a connected dashboard or local alarm. For example, rising turbidity may indicate sediment entering a storage tank after heavy rain. Operators can inspect the site before the problem spreads. This response depends on accurate settings and a reliable connection.
The process is useful, but it is not flawless. Sensors can drift, collect deposits, or respond poorly in extreme conditions. Regular cleaning and calibration are essential. I have found that a quick visual inspection often reveals what digital data misses. A cloudy flow cell, loose cable, or blocked inlet can distort results. Recorded data also needs human review, because one unusual reading does not always prove contamination. A monitoring system supports informed decisions; it does not replace professional judgment.
| Monitoring Dimension | What the System Measures or Does | Typical Technical Details | Why It Matters |
|---|---|---|---|
| pH | Detects whether water is acidic, neutral, or alkaline. | Measured on a 0–14 scale; pH 7 is neutral at approximately 25°C. | Helps identify conditions that can affect corrosion, treatment performance, aquatic life, and disinfection. |
| Temperature | Records the water temperature continuously or at scheduled intervals. | Usually reported in °C or °F; measurement frequency depends on the application. | Temperature influences dissolved oxygen, chemical reaction rates, biological activity, and sensor compensation. |
| Dissolved Oxygen | Measures oxygen available in the water. | Commonly expressed as mg/L or percentage saturation; readings vary with temperature, pressure, and salinity. | Supports assessment of aquatic habitats, aeration, biological treatment, and oxygen-depletion events. |
| Electrical Conductivity | Estimates the water’s ability to conduct electrical current, which is related to dissolved ions. | Typically reported in µS/cm or mS/cm; it is not a direct measurement of a specific contaminant. | Useful for detecting changes in salinity, mineral content, process water quality, or possible contamination. |
| Turbidity | Measures the scattering of light caused by suspended particles in water. | Reported in nephelometric turbidity units (NTU); results can be affected by particle size and color. | Provides an early indication of sediment, runoff, filtration problems, or changes in water clarity. |
| Oxidation-Reduction Potential | Indicates the tendency of water to gain or lose electrons. | Measured in millivolts (mV); interpretation depends on pH, temperature, chemistry, and the application. | Can help evaluate oxidation processes and certain disinfection or wastewater-treatment conditions. |
| Flow and Water Level | Tracks the movement or height of water at a defined monitoring location. | Flow may be reported in L/s or m³/h; level may be reported in m, cm, or another site-specific unit. | Helps assess capacity, flooding risk, pumping performance, abstraction, and discharge volume. |
| Sampling and Sensing | Sensors collect readings directly in the water or through a flow-through sampling chamber. | Sampling intervals may range from seconds to hours, depending on the parameter and monitoring objective. | Automated measurements provide more frequent observations than occasional manual sampling. |
| Data Processing | A controller receives sensor signals, applies calibration factors, timestamps readings, and checks data quality. | Common functions include unit conversion, validation, trend analysis, and missing-data identification. | Transforms raw signals into consistent information that can support operational decisions. |
| Communication | Transfers measurements to a local display, database, dashboard, or monitoring platform. | Possible connections include wired networks, cellular communication, Wi-Fi, radio, or local data storage. | Enables remote access, centralized records, and faster review of changing conditions. |
| Alerts and Actions | Compares readings with user-defined limits or rate-of-change rules and generates notifications. | Alerts may be sent through a dashboard, email, text message, or control-system interface. | Supports early investigation of abnormal conditions, while human verification remains important before corrective action. |
| Calibration and Maintenance | Keeps sensors accurate through cleaning, inspection, calibration, and replacement of consumable parts. | Schedule depends on sensor type, water quality, fouling, temperature, and required accuracy. | Regular maintenance reduces drift, false alarms, data gaps, and unreliable readings. |
Why Choose a Water Monitoring System?
Water monitoring systems support decisions where invisible changes can create visible damage. In drinking water facilities, sensors track pH, turbidity, conductivity, temperature, and disinfectant levels. Operators can identify unusual changes before water quality affects households. Field teams often compare sensor readings with laboratory samples. That habit matters because instruments can drift.
Industrial sites use monitoring systems to control process water and reduce avoidable waste. A factory may watch conductivity during rinsing or measure dissolved oxygen in treatment tanks. Alerts can guide staff when values move outside approved limits. This creates a clearer record than occasional manual testing. Still, alarms need sensible settings. Too many alerts may cause people to ignore them.
Wastewater plants depend on continuous data for biological treatment and discharge control. Agricultural users monitor irrigation water, salinity, and nutrient conditions near sensitive crops. Fish farms measure oxygen and temperature because small changes can stress aquatic life quickly. Environmental researchers place remote sensors in rivers, reservoirs, and coastal areas to observe seasonal patterns. Weather, algae, sediment, and poor installation can affect results. A reliable program therefore includes calibration, sensor cleaning, secure data storage, and trained review. The system records conditions, but experienced people must interpret them.
Water monitoring systems support drinking-water safety, sanitation and wastewater management, and hygiene services by providing timely data on water quality, contamination risks, and operational performance.
The chart shows the estimated share of the global population using selected safely managed or basic water-related services in 2022. These figures are reported by the WHO/UNICEF Joint Monitoring Programme and are used here to illustrate the major service areas where water monitoring can support reliability and public health.
A water monitoring system can turn invisible changes into clear, usable information. Users should consider how quickly it detects problems, not just how many features it offers. A sudden rise in turbidity may signal sediment entering a storage tank. An unusual conductivity reading may indicate mineral buildup or contamination. Early alerts can help operators inspect equipment before water quality declines. That can reduce waste, emergency repairs, and unnecessary manual testing.
Accuracy should remain a central benefit. Reliable systems use calibrated sensors and provide clear records for temperature, pH, turbidity, conductivity, or disinfectant levels. Users should ask how often calibration is required and whether test results can be verified independently. A system with poor data may create false confidence. That is risky.
Ease of use matters too. Staff should understand alerts without reading a lengthy manual each time. Mobile access can help technicians check readings near a treatment room, tank, or remote pipeline. Secure data storage also supports maintenance planning and documented quality checks. Yet convenience has limits. Sensors can drift, batteries can fail, and wireless connections may stop working. Practical inspections should remain part of the process.
Look beyond the display. Consider installation costs, replacement parts, training, and compatibility with existing equipment. A cheaper system may become expensive when sensors need frequent replacement. In real operations, small delays can matter. Users should compare documented performance, service support, and reporting clarity before choosing a system that fits their water environment.